JS-50 Board Scanner Demo Documentation
Key Features
- WPF Application using .NET Pinchot API v16.3.x
- Ability to connect and start scanning boards or load previously saved board data
- 3D visualization of board data (profile points) using HelixToolkit.SharpDX.Core.Wpf
- Data analysis of the scanned board including width, length, height, and wane
- 2D top-down view of the scanned board using OxyPlot
- Utilizes the JS-50 line of ScanHeads, supporting both camera and laser driven heads, as well as single or multiple heads. If using multiple ScanHeads that are spaced apart, be sure that their JsSetup IDs match their physical ordering. That is, the ScanHead with ID=0 should be the ScanHead closest to the encoder value of zero / the beginning of the sled, ScanHead with ID=1 should be placed after ID=0, etc. If using multiple ScanHeads and not top down, every pair of heads must share the same distance and their lasers should overlap each other.
Application Flow
Note
Before running the application, ensure that a JsSetup configuration file has been placed in the Data folder and that the configuration file is located in the Utilities folder. Additionally, the encoder must be plugged in so that all encoder values are positive: position the sled as close to the encoder as possible. This is due to array indexing using the encoder value for rotation and width calculations.
Note
If the scanned data is unexpected, please try experimenting with the Configuration file settings.
After starting the application, it should look like this: 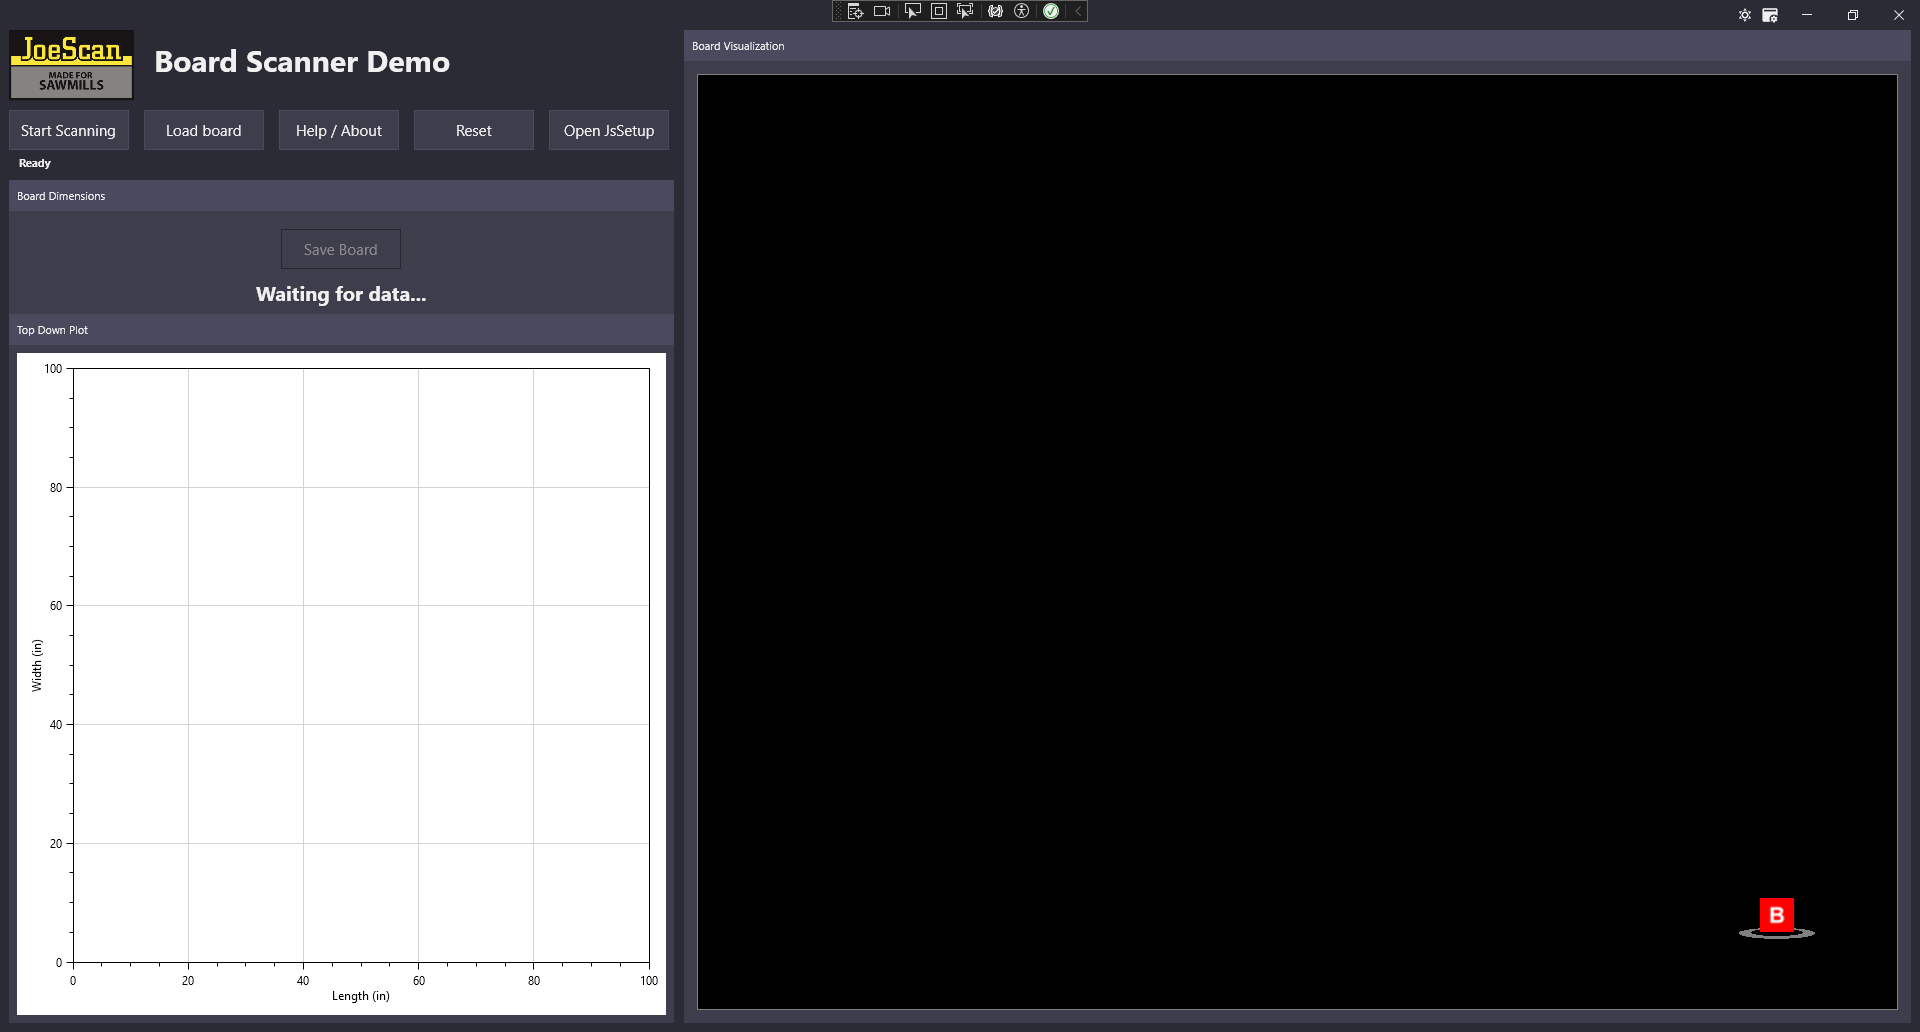 Note that you can toggle light and dark mode and that the configuration file is editable while running the app.
Scanning a board in either direction is supported. Scanning a board that is not aligned with the sled (i.e. rotated or off-center) is supported. The application will determine the axis of rotation and re-orient it. If the board appears to be missing some corners after scanning, it is due to the board being out of range of the scan windows.
The save board button is not clickable until an entire board has been scanned. The ScanHeads must reach the end of the board (if the distance between ScanHeads is zero), or be moved by a preset distance, (not just be turned off), for a board to be considered scanned. At this point, it will undergo board calculations. If you stop scanning a board before it is finished, and then start scanning again, the previous scan data is not saved.
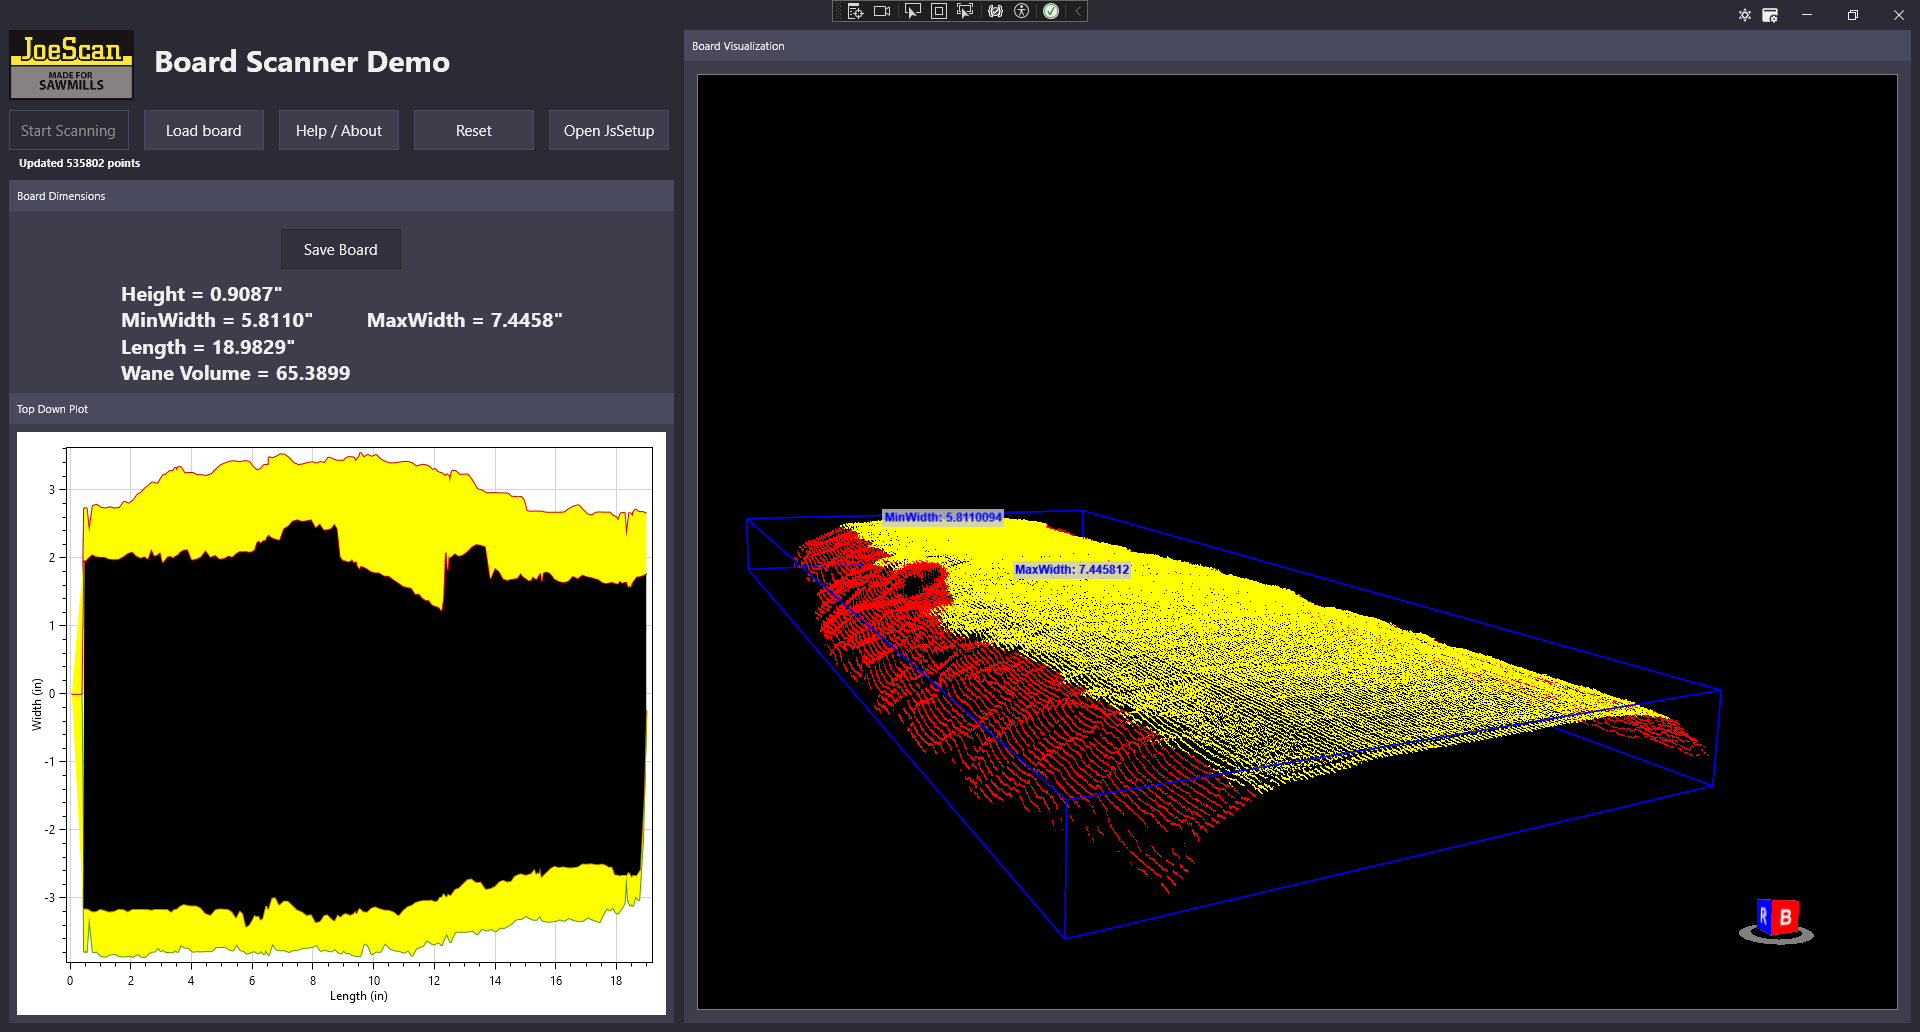
To begin, either load a board or scan a board. If you choose to load a board, you will have to click Reset to be able to start scanning. After the end of the board criteria has been met, scanning will automatically stop. After the board has been processed, it will show up in the graphics window with the sides displayed as blue for a straight edge or red for wane. The plot section displays the top-down view of the board with the wane/edge in yellow. It is dynamic and can be zoomed in/out, but automatically fits to size initially. The data plotted has been decimated so that not every single data point is plotted, but it can be scaled up through the configuration file.
After the board has been calculated the application will display board measurements in the text section as well as draw a bounding box around the scanned board and min and max width billboards.
Note
If the scanned data points stay light blue and nothing shows up, there are two possibilities why the board did not finish calculation. Either the end of the board criteria was not met, or an error occurred while processing the data most likely a failure in the height line calculation. Check the log file for more details, located at 'C:\Users{USERNAME}\AppData\Local\JoeScan\JSDemo'. If a board appears to be missing middle profiles or the widths are suspicious, try increasing the Encoder combination value in the configuration file. If the potential cut without wane is too small, try increasing the wane noise tolerance. If it cuts off important information at the ends of the board, try decreasing the start distance.
Even if a board is already displayed, both loading a new board and start scanning will reset and a new board will be processed. The reset button disconnects from the ScanHeads, clears board data, and resets the camera view. There is no functionality for displaying multiple boards at the same time.
The JsSetup button will launch the JsSetup app, as long as the configuration file path is correct. It will automatically load the JsConfig file specified in the configuration file. JsSetup must be closed before resuming the Demo app execution due to possible ScanHead connection issues.
As specified in the Help/About popup, there are a number of keybindings.
Right-click on the Start Scanning button to use a different JsConfig file than is specified in the App.Config file.
Within the graphics window, X resets camera view, O toggles rotation around the center of the board, B toggles using gray-scale brightness values, F enables visualization fullscreen, and C shows a potential cut without wane and toggles the bounding box and billboards.
For different board views, R views the right, T views the top, Y views the left side, and U views the other end of the board.
XBox controls are also supported. The left joystick controls camera left/right and up/down movement, the right joystick controls rotation, and the right trigger pans up while the left trigger pans down.
The bound XBox buttons are: A to reset camera, Y for rotation, B for brightness, Back for fullscreen, X for bounding box and cuts, and D controls to view the board from different perspectives.
After a configurable idle period where there is no mouse or keyboard interaction, the board will begin automatic rotation.
Note
To move around smoothly in the 3D view via the mouse, the camera will move much faster if you are hovering over the board when you click and hold to move.
Closing the app will NOT automatically save a scanned board, you must manually click the Save Board button, or use the F2 hotkey.
The log file is saved to 'C:\Users{USERNAME}\AppData\Local\JoeScan\JSDemo'. The log file saves errors, warnings, and state information.
Configuration File Details
- IdleTimer (int): time in seconds before demo goes into idle mode and automatically starts rotating the rendered board.
- ScanSyncID (uint): the ID of the scanSync being used.
- CenterDistance (float): distance used from the center of the board to determine height line. Used for both x and y. A larger distance will result in more profiles being used to calculate the height line.
- EncoderPulseInterval (double): This can be found with JsSetup.
- BottomThreshold (float): distance from the bottom used to consider points as board edge points. Increase if it seems that no edge points are being picked up.
- HeightTolerance (float): distance used to determine how far a point needs to be below the height line to be considered wane.
- NoiseTolerance (float): distance used to determine how far two adjacent points in one profile need to be to be considered as noise points are not. A smaller noise tolerance will require points to be very close together to be added to the board data.
- StartDistance (float): the distance required to classify if a board has started. That is, how far of a distance has to be traveled before a collection of profile parts is considered to count as a board. This value is also used to identify and eliminate board end data. If the end of a board is very diagonal, try increasing this value.
- MinimumPoints (int): the minimum number of points that are counted to make up a profile that is picking up a board. Recommended to increase this number if profiles are getting past noise elimination when they should not be.
- WaneNoise (int): the size of the moving window used to filter out noise points. The larger the wane noise, the less responsive the potential cut will be to wane indentations.
- StraightSlope (float): the minimum slope value for a set of points to be considered as a straight edge. A higher value will only allow very straight edges to be drawn in blue.
- MinRotation (float): the minimum slope value found along the side of the board for rotation of the board is performed.
- DataFormat (JoeScan.Pinchot.DataFormat): If using quarter resolution, the minimum points should be lowered and the noise tolerance should be raised. The data format must include Brightness.
- ScanningMode (JoeScan.Pinchot.ScanningMode): either Profile or Frame.
- JSConfig (String): filename for the JsSetup configuration file located in the Data folder of the published application.
- JsSetupPath (String): local path to the JsSetup executable file starting from from the Desktop folder.
- IdleScan (bool): whether IdleScanning should be used or not.
- IdlePeriod (uint): the period for IdleScanning in milliseconds. Note that this must be some value, even if IdleScan is not enabled.
- TopDown (bool): indicates if the scanners will only capture top-down views of the board.
Note
Note that for top down scans over boards with straight edges, the straight edges will barely, if at all, be picked up by the scanhead, and thus the board might look as if it does not have straight edge sides.
- DistanceBetweenLasers (long): the distance that the lasers are apart from each other in inches, if multiple are in use. For a Z8, this would be 3. For a single laser line, or overlapping lines, this should be 0.
Note
If multiple lasers are enabled at different distances, then the MaxInterval parameter must account for the additional possible distance (easy solution is to multiply by the number of lasers).
- Recenter (bool): whether or not the board should be rendered in the 3D view as roughly centered while scanning (true), or placed directly in front of the camera after the board has been calculated (false).
- MaxInterval (uint): the range of possible encoder values, used to create a distance array that is indexed by encoder value. This is the reason that the encoder must be plugged in at the bottom (so that the encoder values are only ever positive).
- EncoderCombination (int): the value that the Encoder value is divided by for distance array indexing. Use a higher value if the encoder values change faster than the phase table can keep up with and the width calculations do not seem to be accurate. If the board undergoes rotation and it appears that data is lost, increase the EncoderCombination number for more data retainment.
- PlotRound (double): the value that the data points sent to the topdown plot will be scaled down by. A larger number will create a smoother graph, a smaller number (etc 0.005) will include more data points in the graph.
- PlotAvg (int): the number of points used to create the average moving window that smooths out the 2D plot. A larger value will create a smoother graph.
- CameraPos (X, Y, Z floats): the starting camera position and the position that the camera is reset to.
- CameraLookDir (Length, LengthSquared, X, Y, Z floats): the starting look direction and the look direction that the camera is reset to.
- CameraMoveSpeed (float): the speed that the camera moves around by on XBox controls.
- CameraRotateSpeed (float): the speed that the camera rotates by on XBox controls.
- Recenter bool: Center data while traveling.
Pinchot API Usage
Most of the calls to the Pinchot API are in Models/ScanHeadManager.cs. This application uses a JsSetup configuration file to connect to a ScanSystem, but everything from the configuration file can be done using the Pinchot API.
ScanHeadManager.cs has an example of manual configuration at the bottom of the file.
Additional Pinchot usage is used throughout the Model folder for the Point2D type, Encoder value, and ScanHead and Camera identification.
ScanHeadManager.cs connects and configures the ScanHeads
    scanSystem = ScanSystemParser.CreateFromFile(filename);
    scanSystem.Connect(TimeSpan.FromSeconds(1));
    scanSystem.SetScanSyncMapping(FindDimensions.Config.ScanSyncID);
StartScanningAsync may be called. StartScanningOptions are set, StartScanning() is called, and after which, if using frame scanning, one receiver thread is created to receive the profiles using TryTakeFrame() and GetValidXYPoints().
Frame scanning simplifies the process of managing multiple ScanHeads manually. Each frame also provides the camera, laser, id, and profile information. The profile includes XYPoints and Encoder values.
StartScanningOptions include the scanning period, data mode, scanning mode, and idle scanning.
This example includes setting IdleScanning, as well as profile scanning instead of frame scanning, although frame scanning is recommended.
The scanSystem should be disconnected once finished.
Further notes about the Pinchot API:
- Does
GetValidXYPoints()return the points in an ordered format by X value? Yes. - What is the range for Point2D.Brightness value? Between 0 and 128.
- Do the different laser profiles for the Z8 automatically send distance values three inches apart? No.
- What are the encoder values and how are they used? The encoder key is a role: Main, Auxilary1, Auxilary2, and the long value is the number of ticks. The Encoder Pulse Interval must be determined (can be found by using JsSetup) and use both to find the distance (z value).
Data Analysis Approach and Assumptions
Warning
This demo is a very simplified approach to processing data captured by the Pinchot API and is not considered optimization software. Decisions made on how to process board data may fail in certain conditions such as board warp, board bounce, board curvature, etc.
- How to determine what data points are of interest (board points)? Simple solution: determine by height above threshold (set window with Pinchot API / JsSetup).
- How to determine if the profile contains an object? See if there are a specified points above threshold height, assuming no noise. Ideally, noise should be eliminated in setup.
- What is the criterion for the start of a board? Configurable distance traveled with the same seen object.
- How to determine the height of a board? There are many options, listed here in progressively robust solutions. 1- find the centroid and use its Y value. 2-find a rough estimate of the height through a centroid point and then use a collection of profiles to select points near the height estimate and fit a line to those points. 3-fit a plane to the estimate of the top of the board and use its y-intercept as the height.
- What width information is of interest? This program stores overall board min width, overall board max width, and max width per inch (stored in board structure as an array).
- What wane information is of interest? Where wane begins. How to determine wane start? Answer: fit a line to the top of the board, classify wane by walking along a profile and finding the first points below the line.
- How to determine if the side of a board is wane or a straight edge? A few options: could combine some wane profiles on each side and fit lines and determine if their slope is steep enough. This is not a sufficient method for a board where the side can have a straight edge and wane. A more robust approach might be to fit a line along the side of the board and classify any points within a certain distance of the side of the board as a straight edge, and any points not within that region but below the height line as wane.
- What is the significance of having multiple scanners in lineal scanning? Answer: multiple scanners mean that a greater range of data is captured: for a board with steep edges, one overhead scanner will not capture the full shape. For lineal scanning, the lasers should ideally overlap each other, and at least be parallel.
- How can the two different ScanHeads data be utilized together? Answer: Since the overall goal of multiple scanners is to combine their data, you will likely need to organize the received profiles by distance. For example, when calculating width across a board section, you need to utilize all of the profile information for that distance. Note: since the phase table ensures that the lasers are never firing at the same time, if the board is moving extremely fast, the profiles might not share the exact same encoder value.
- How to handle if the board is scanned at an angle? Answer: one approach is to find the center z-x slope from fitting a line to both end sides and then rotate all the points with the angle made from that slope around the y-axis. When doing this take care to not include points at the end of the board. After rotating the points and reassigning them encoder/distance values, you may sort the points within each distance value and then treat them as typical profiles to iterate through.
- How was the cut without wane determined? This demo uses a simple approach where the wane edge points form constraints for a linear programming problem where the objective is to maximize the distance between two parallel lines along the edge points.
Additional Program Logic Notes
Note
If there is no distance between lasers, the profile data is relatively sorted by distance, but it takes longer to scan a board since the entirety of the board will have to travel past the one point. A key difference on whether the scanners are top down or not is that a top down view will not capture the edges of a straight-edge board. With multiple ScanHeads looking at the same thing but from different angles, their range might overlap and the X ranges vary. This key difference becomes important in the code logic.
-
For a setup with a DistanceBetweenLasers of zero, the board data collection begins when a certain distance has been traveled where continuous profiles with enough points have been seen. Otherwise, board data collection begins immediately after a profile with sufficient data points has been captured. While the board is being processed, a buffer is sent to the ViewModel to provide real-time rendering updates. Data from the ScanHeads is stored in multiple formats, including the StartQueue which will later be iterated through for data processing, Angle points which are used to determine the rotation, and AllPoints and BrightnessList which are used to recreate the StartQueue if a board needs to be rotated.
-
Once the end of a board has been reached or the given distance has been traveled, the board information is processed and saved before resetting the data structures.
-
Before any board information is saved, the angle lines are calculated using MathNets Line.Fit to determine the board needs to be rotated around the y-axis. If so, the points are rotated and assigned to the OrientedDataArray, indexed by their distance value. To make this properly indexable, the distance value is transformed into an integer by reverting to the Encoder Pulse Interval value. After each point has been given its new X and Y value, everything is pulled out of the OrientedDataArray, sorted by X to recreate the standard profile format, and put in the StartQueue, which was previously cleared. This makes it so that the same logic can be applied for board calculation whether a board is rotated or not.
-
The board start, end, and length is then recorded. In order for the board to be orientated so that it starts at 0 when plotted, the offcenter value is calculated and used for subsequent distance calculations.
-
The first run through of StartQueue is used to find the height and board center. The height is determined by selecting profiles near the center of the board and fitting a line to them. At the same time, an approximate center of the board is found to use later when distinguishing between the left and right sides of the board.
-
StartQueue is then iterated through again to find the edge points, that is points along the sides of the length of the board. For a top down setup, these points are simply the first and last of the profile, otherwise, these points are chosen if they are below a threshold height. These edge points are used to fit a line along the edges, which will be used for straight edge detection when looking for wane.
-
Following is another StartQueue iteration to find the ApproximateWidth at the edges of the board. By using the found height and traveling along profiles, the first wane points (below the height threshold) are grabbed near the beginning and ending starting distance of the board. These points are used for eliminating the width ends of the board that the ScanHeads might pickup, as such points have potential to disturb further calculations.
-
Finally, the main data processing is done through calling UseBoardPoints on each profile. UseBoardPoints() uses the calculated ends to eliminate profiles near the end of the board that have wane inside the width. This function also implements simple noise reduction by ignoring points which are outliers based on prior X and Y data. Each profile is walked through to find the starting wane points, and the possibility of straight edges. Points are classified as straight edges if they are close to the lengthwise edges and form a near vertical line when plotted. A walk along a profile first looks for the initial right wane point, which is added to a data structure for the 2D plot, and, if possible, straight edges points. The same is done for the left side. Using the distance array to find the absolute minimum and maximum X values for the given distance, the width is stored. All profile data that was not determined to be noise is then put in the 3D data structure to be rendered with Helix toolkit.
-
Lastly, a final run through of the profiles is done to grab the boards minimum width and add board edges to data structures for the 2D plot.
-
A potential board cut is determined using linear programming and the wane edges previously found. The wane edges create inequalities and the optimizers goal is to find the maximum distance between two parallel lines along the wane edges. That is, it finds the widest possible cut without intruding on wane. The wane edges are filtered and then considered absolute before being sent to the solver.
-
After the board has been processed, the 3D viewer will display the color coded board, as well as dimensions. A further call is made with OxyPlot to render a top-down view using the board edges that were previously stored.